Sales Statistics

Of course, you want to know quickly where you stand. This screen will show you all the numbers in a row.


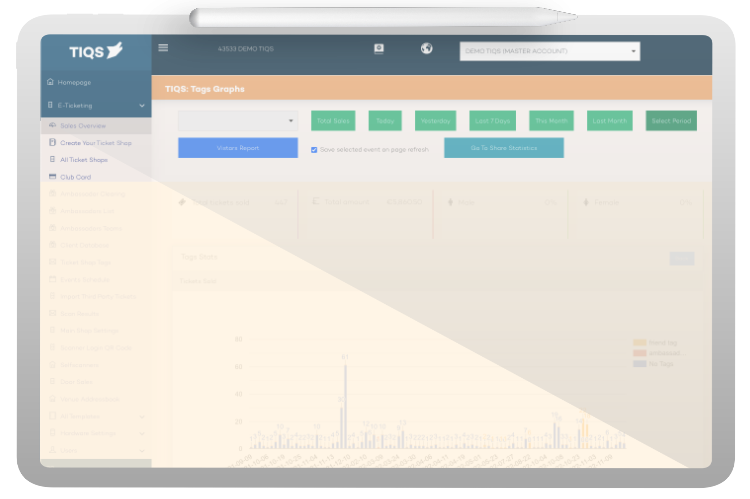
Simply select the event and time period

Understanding all your events or just from one event (using the dropdown).

You can pin this event by clicking the checkbox.

Besides selecting the event you will find the recorded periods, Total (over total sales, Today, Yesterday, last 7 days This month, last month. Of course, you can also select your own period.

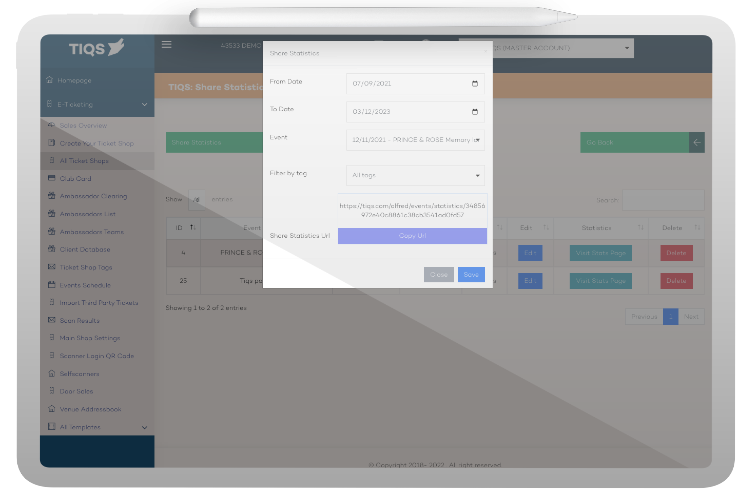
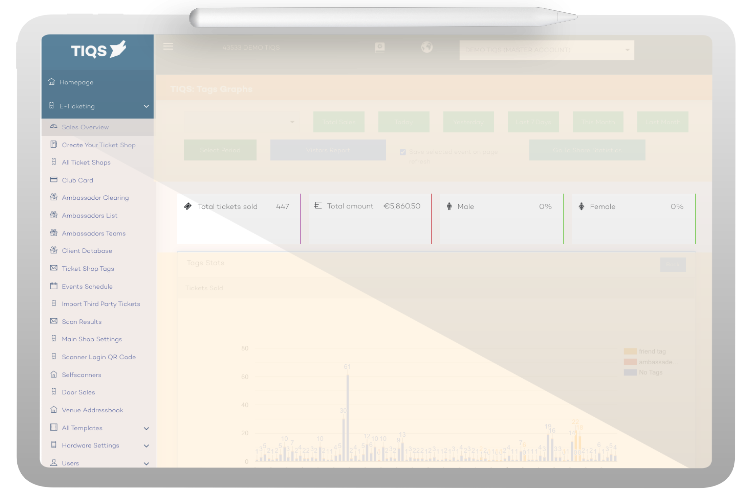
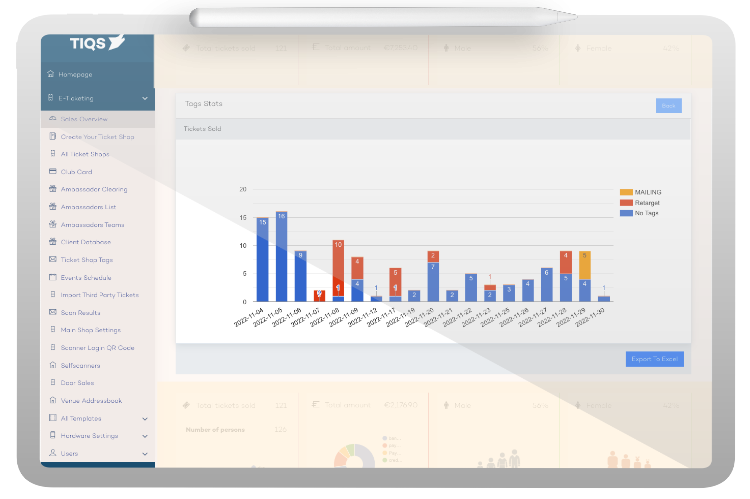
All the numbers at a glance and clear insight into what you have converted, how many tickets of what type you have sold and how many people you can expect. You can also share this with a partner. For example, you can share sales statistics with a partner who sells tickets for you or with a venue who wants to know how many people are coming.


image

Share your statistics with others

You can also share a statistic with a third party. This allows you to specify which period this statistic may be shared, which event and based on which "tag". A unique url is generated that you can share from your external partner.


image

Instant insight into your sales

The following statistic shows the turnover of your selection depending on your period choice and events.

This gives you instant insight into the number of tickets sold, turnover and percentage of men and women.


image

Using Tiqs Tags to filter your big data

A Tiqs Tag is your own "label" that you can attach to a marketing/sales. Such a tag gives you an extra possibility to map sales./ The Tag is given to the shop and in combination with can also be linked to an Ambassador.


image

Data that tells where your visitors are coming from

Knowing where your visitors come from makes it even easier to shape your street campaign effectively. But it also gives you more insight into visitor flows and it is therefore useful to have this for your contingency plan.


image